
How conversion rate can easily lie
Business summary: Conversion rate can be very misleading metric when calculated from sessions instead of users.
Conversion rate has been here since the Web Analytics as such exists. The holy grail of online marketing, every single one of us uses it and hopes that it grows in time. No doubts about its universal usage when evaluating almost any dimension view. Although there are couple of cases when we shouldn't rely on it at all. Let's have a look at one example when it seems that our business is perfectly fine, but slightly different perspective will show that reality is far cry from what we see in standard view.
Traditional view
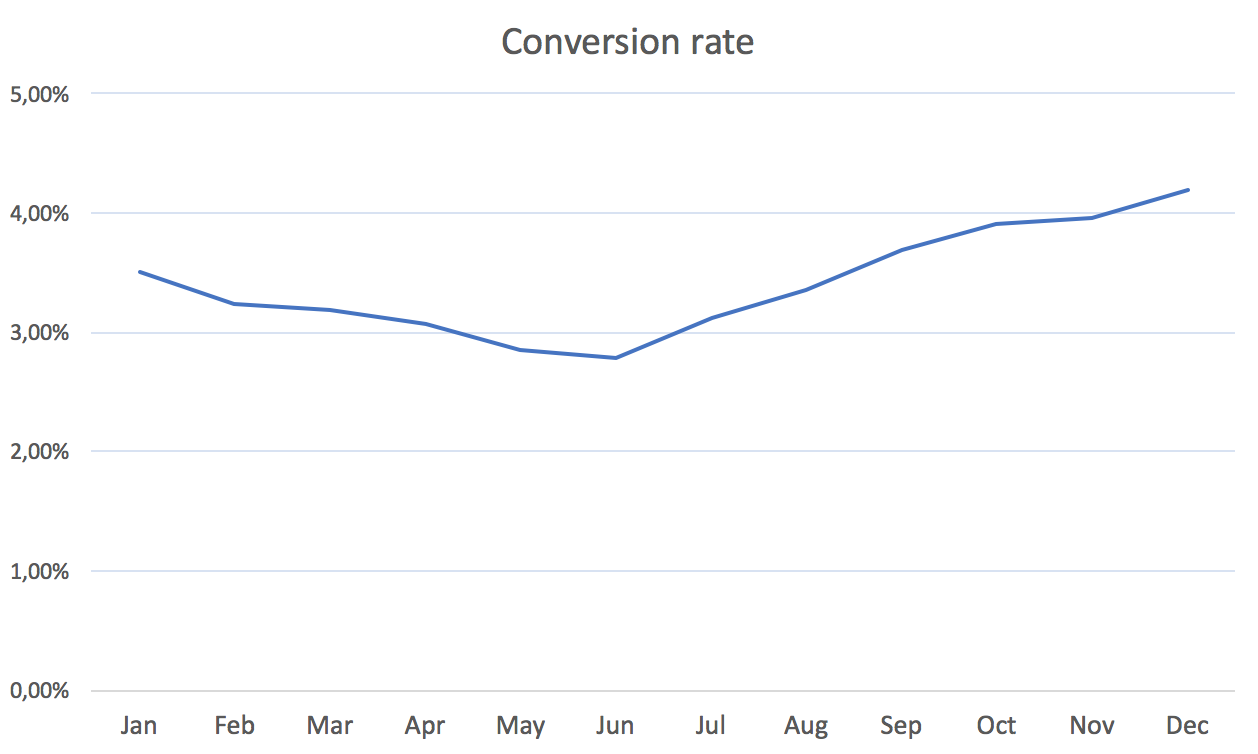
Imagine we have a hypothetical e-commerce project and we're about to evaluate the whole year. The very common view we all use is to look at conversion rate trend in time. This is how it looks in the most of the websites. It's growing the closer we are to the Christmas.
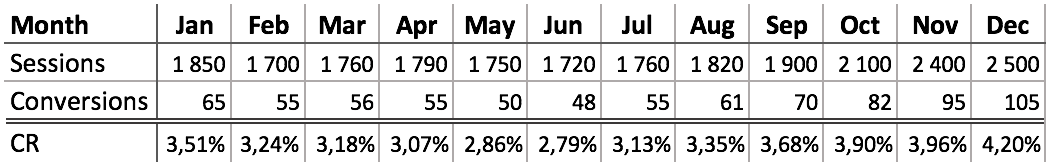
So far, so good, everything as we expected. Well, we're still a bit suspicious, right? We want to reassure that the business is growing, so we look at total revenue trendline.

As clear from the chart we had a huge growth in the end of the year, so we can open a champaign and celebrate.
Slightly different view
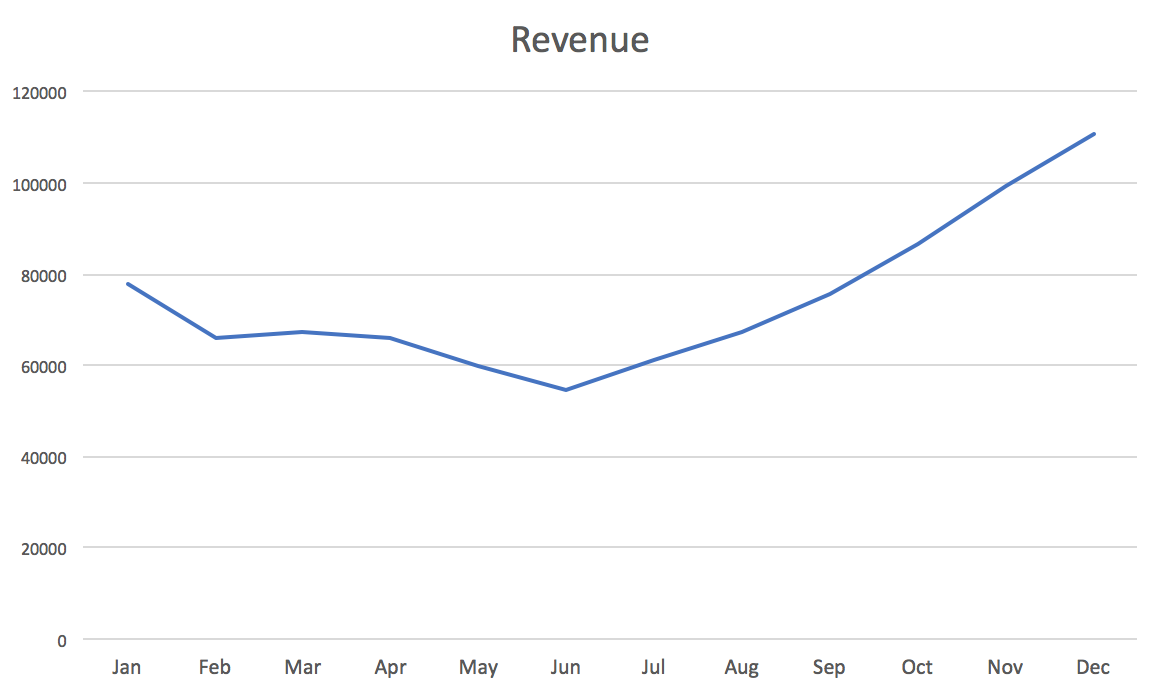
What if we only do one change and instead of using sessions we start all the calculations with users. Not that massive switch, right? Every enlightened analyst should use it! Let's have a closer look how a charts will look like. For better illustration I left there also conversion rate from the first chart based on sessions as we all know it, as well as data from previous table.
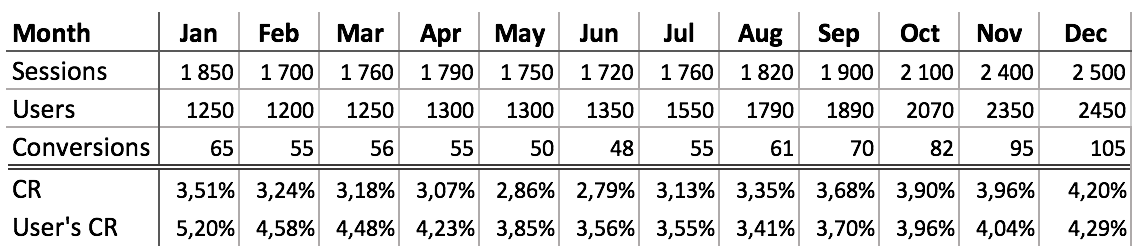
As obvious we might not be as happy as from previous "reassuring" charts. All we did here is that we just added number that actually makes more sense - User's conversion rate. We have the same volume of sessions and same amount of conversions. Of course we have hypothetical data, but I've seen couple of e-commerce projects where this wasn't far from truth, at all. What basically happened in the end of the year is that we weren't able to convert as many users as in its beginning. Even though, we were able to generate amount of money we expected, it's obvious that something happened in the second part of the year. Let's add one more chart to easier understand the problem.
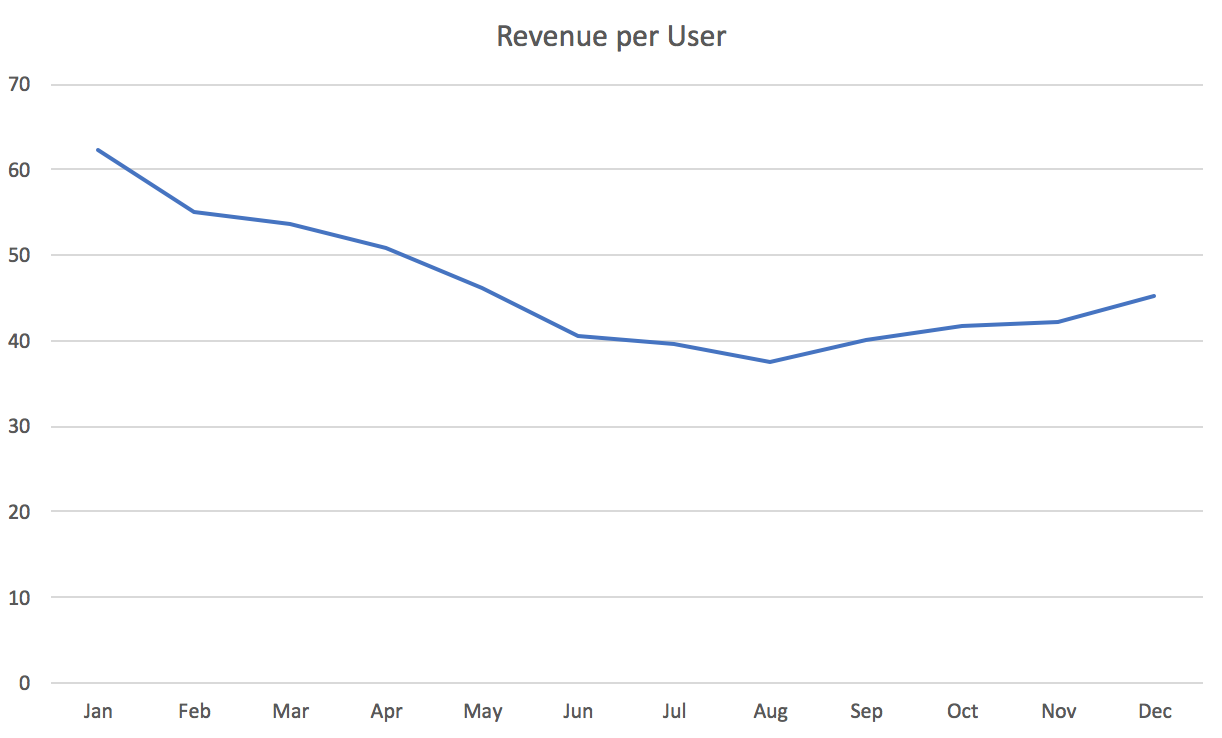
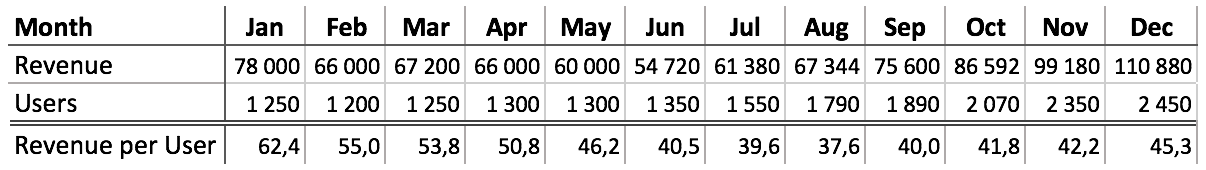
"Revenue per User" confirms the fact that we didn't just converted less users, but we also dropped in IMHO one of the most important calculated e-commerce metrics. There can be many reasons like worse product inventory, missing additional services, change in pricing policy, different channels mix, not-working new loyalty program and hundreds more.
Combined view
We all know that it's not possible to use user scope conversion rate every time. The good example are traffic channels. It's impossible to divide users by them. So, the solution is if possible to combine the session view with at least one user scope dimension view. It would be a mistake to cut corners just by being lazy to create a custom report to see what's important. As we see in the hypothetical example above it's very easy to get fooled by session scoped conversion rate. Mentioned user scope metrics will give more realistic view on business and help you identify that something might be wrong. User scope analytics definitely isn't just a to-be-cool-analyst myth. The ball is in your court.
Happy user scoping :)